Student Impact Tracking
Measure what matters.
Every student story is bigger than a gradebook. Pulse helps schools and districts track the full picture of success across academics, social-emotional growth, engagement, and interventions.
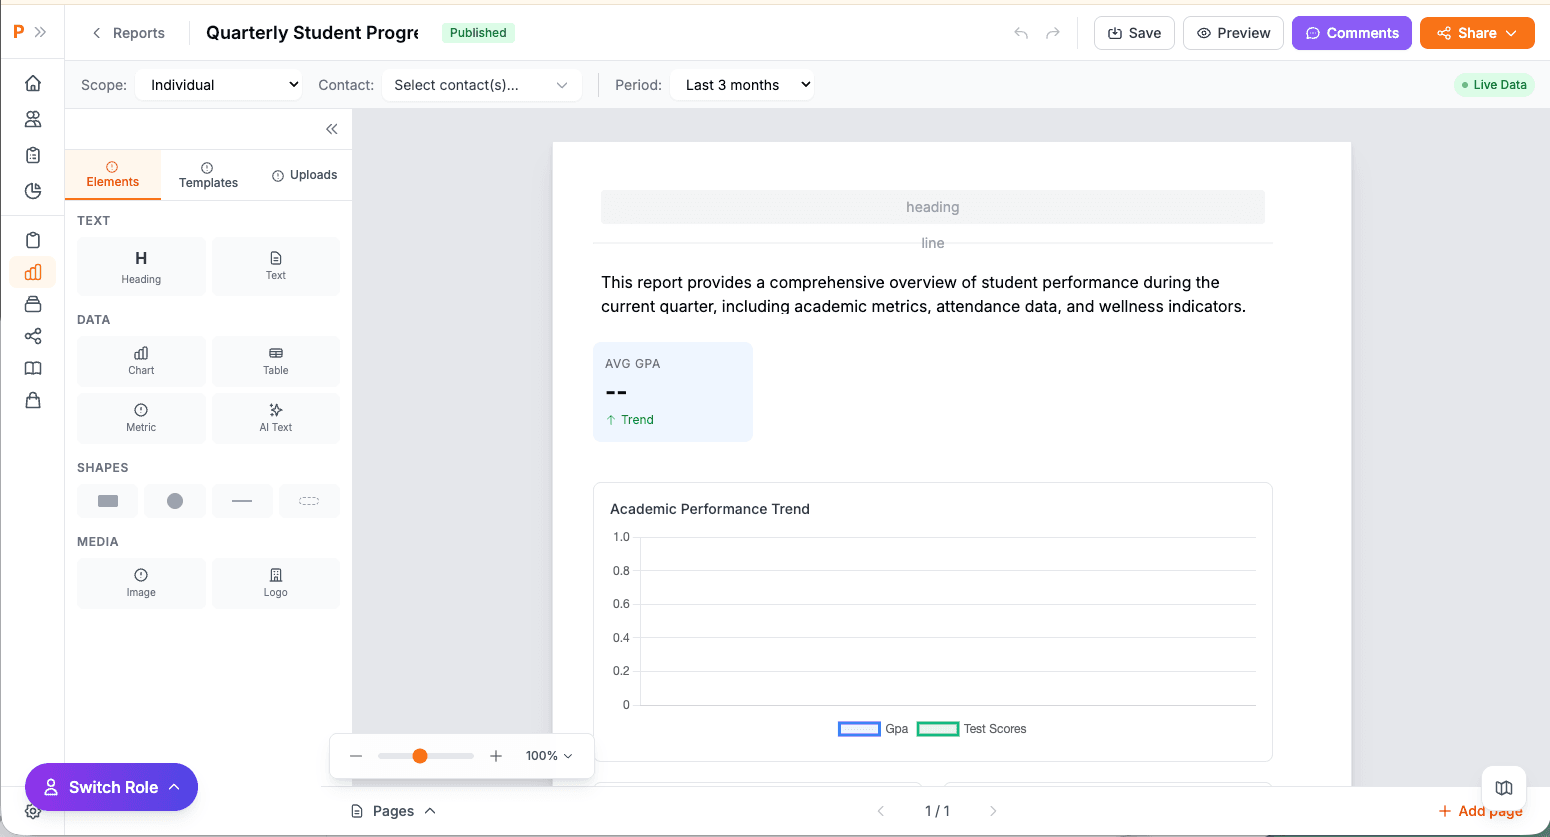
Quarterly Impact Reporting Surface
See The Whole Student
Pulse integrates existing academic, attendance, and behavioral data with teacher observations, support plans, and wellness metrics into one unified view. Combine academic and behavioral data in one location. Track attendance, interventions, and supports over time. Include SEL, wellness, and engagement indicators. Detect patterns affecting student outcomes early.
Maya Johnson
Grade 5 -- Room 302
Academic
82/100
SEL
74/100
Attendance
91/100
Wellness
68/100
Last updated: Today, 9:15 AM
3 active supports
Engagement Alert
Maya's engagement dropped 3 weeks in a row
Engagement Trend (8 weeks)
Week 1
Week 8
Auto-triggered: Support task assigned to Ms. Chen
Early Intervention, Built-In
Automated alerts and task workflows enable rapid response when data indicates concerns, ensuring consistent student support and visibility. Receive alerts for attendance declines or academic struggles. Trigger support tasks automatically for counselors and staff. Track interventions and follow-up results. Close the loop on every student support plan.
Cohort Overview
Maya Williams
Jordan Lee
Alex Johnson
Sam Carter
Cohort Wellness Trend
+20pts since SepCohort View
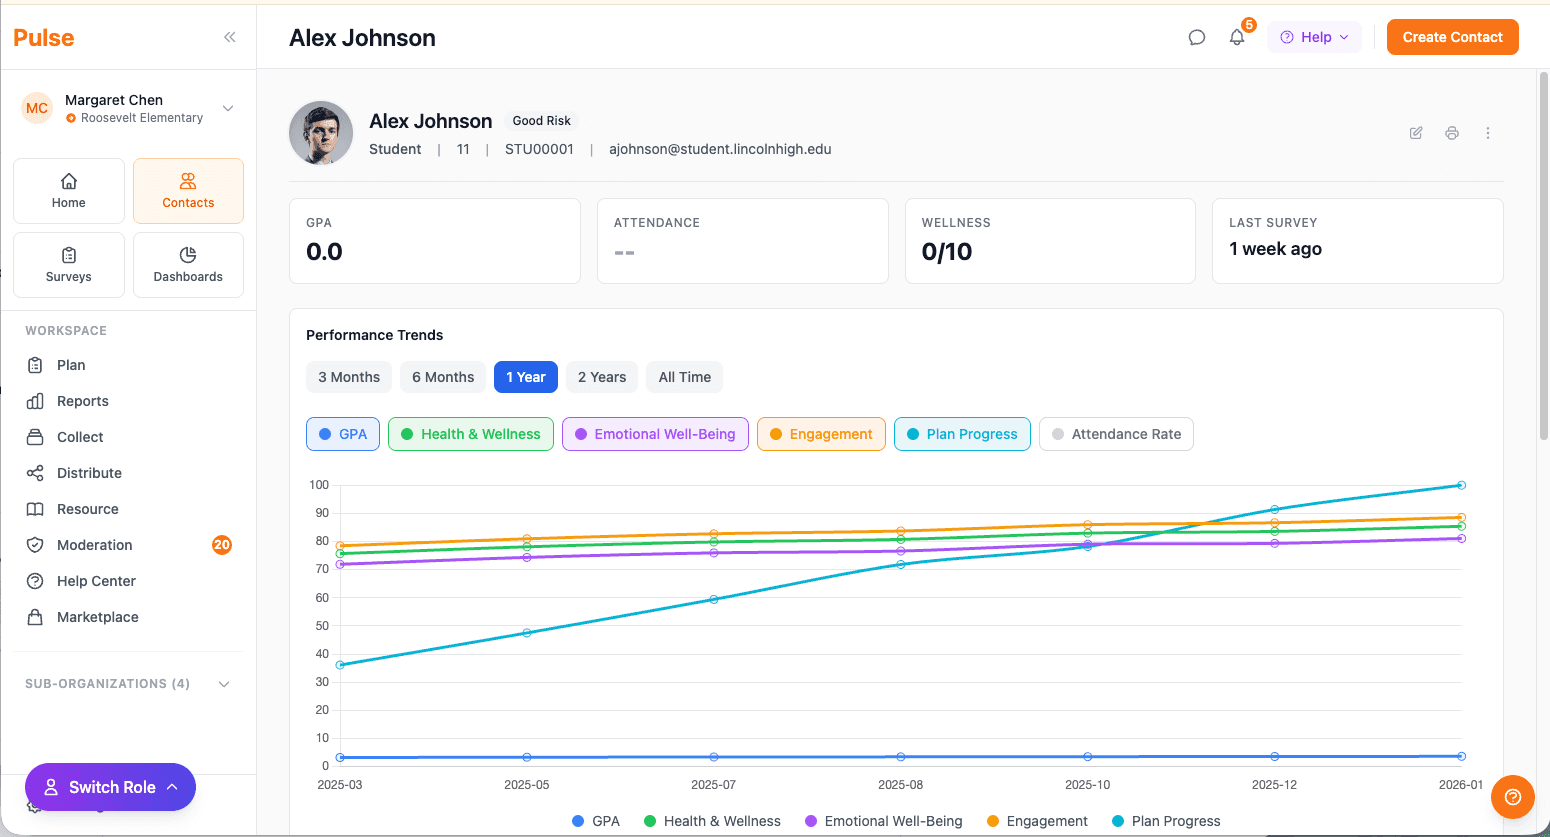
Every student, in context
See status indicators at a glance for every student in a cohort. Wellness trends over time surface patterns that individual check-ins might miss, helping teams prioritize where support is needed most.
Real Context Beyond The Numbers
Teachers and counselors add qualitative insights -- notes, check-ins, reflections -- providing leadership deeper understanding of each student's experience. Log social-emotional observations directly. Capture student reflections and teacher notes. Include context alongside quantitative data. Turn anecdotes into measurable insights.
B+
Math
A-
Reading
88%
Attendance
Counselor Note
Mar 15“Maya shared she has been helping care for her younger sibling after school. This may explain the homework completion drop. Family support referral in progress.”
Linked to support plan
Teacher Observation
Mar 14“Maya is highly engaged during group work but withdraws during independent tasks. May benefit from structured peer partnerships.”
Equity Dashboard
All Students
78%
82%
88%
ELL Students
71%
74%
69%
SpEd Students
68%
85%
72%
FRL Students
73%
76%
66%
Gap detected: FRL students 22% below avg in program access
Equity through Visibility
By connecting data across classrooms, programs, and schools, leaders monitor equity in outcomes and access. Track subgroup progress and participation. Identify gaps in support or engagement. Align resources where most needed. Share transparent progress with community.
Why It Matters
Proactive Support: Address needs before escalation. Holistic Insight: Track the full spectrum of student growth. Equity & Accountability: Ensure every student succeeds.
Proactive Support
Address needs before escalation
72%
earlier detection
Holistic Insight
Track the full spectrum of student growth
4x
more data points
Equity & Accountability
Ensure every student succeeds
100%
subgroup visibility
Pulse is built by the Exponent Group, a 501(c)(3) nonprofit. We exist to build tools and equip people to restore their own communities.